I have experience with a wide range of statistical data analysis techniques, including:
- Logistic, linear, mixed-effects, negative binomial, and zero-inflated regression
- A/B testing
- Bayesian hierarchical models
- Bootstrapping
- Cluster analysis
- Principal component analysis
- Dynamic factor analysis
- Autocorrelation analysis
See below for a few examples of data analysis projects I have worked on.
As a product data analyst at Remitly, I designed and analyzed A/B tests to understand the impact of product features on customer behavior. For one test to understand the impact of providing more direct access to contact a customer service agent from the app, I began by identifying customer behaviors and related metrics that could be impacted by the new button and key metrics to be used in determining the success of the feature. I then analyzed historical data to define the sample sizes need for detect significant changes in key metrics and associated timelines using SQL and Python and developed a Sisense Periscope dashboard to monitor customer behavior and metrics throughout the experiment. Once the experiment was concluded, I conducted statistical analyses and wrote a report summarizing findings and recommendations for business stakeholders.

At Remitly, when customer issues cannot be addressed by initial customer service providers, they may be escalated to more experienced or specialized customer service providers to resolve the issue in a timely manner for the customer. To understand the impacts of escalating a customer issue, I conducted in-depth analyses summarizing the impacts on metrics including additional customer contact events and completed transactions by the customer. I summarized the findings of this analyses in a report and presentation to business stakeholders, suggesting potential improvements to the program.
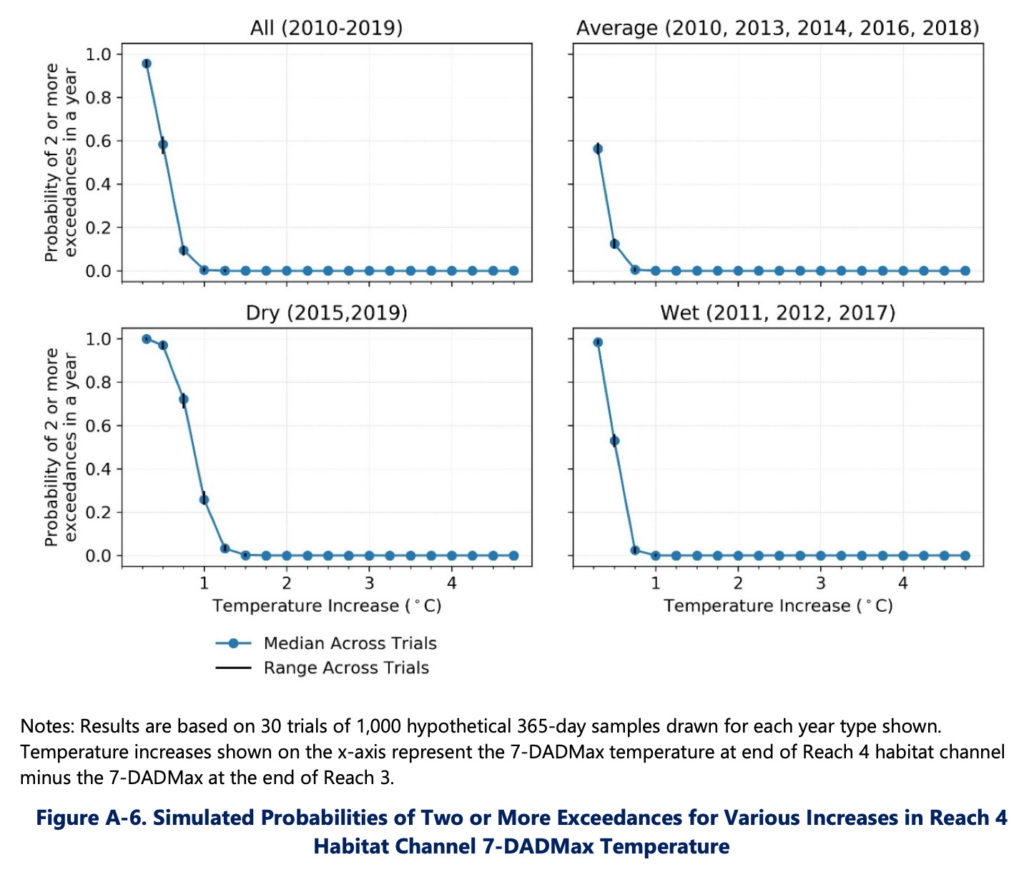
For a project I worked on at Four Peaks Environmental Science & Data Solutions evaluating aquatic life use attainable in the Chelan River, I conducted a bootstrap analysis to evaluate the probability of the water temperature exceeding certain thresholds. Bootstrapping is a data-based simulation method in which samples are randomly drawn with replacement from existing data to produce a large number of hypothetical data sets that can then be used to make statistical inferences of the underlying population. For this project I compiled relevant historical temperature data, analyzed temporal autocorrelation and inter-annual variability to inform the methodology used, implemented the bootstrapping algorithm in Python, created visualizations to communicate key findings, and summarized the findings in a report (see Appendix 1 of Chelan River Use Attainability Analysis).
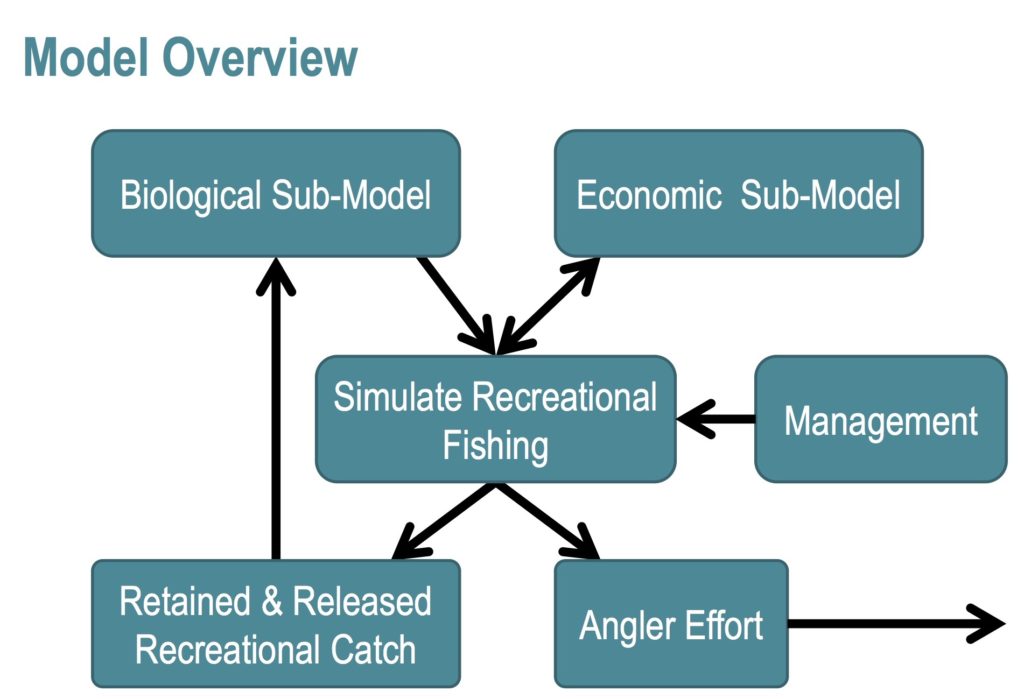
Recreational fisheries make up a substantial portion of catch for many U.S. West Coast fish stocks and are economically, socially, and culturally important. It is difficult to predict how changes in recreational fisheries regulations (e.g. bag limits, size limits, seasonal closures) will influence recreational angler effort and recreational fishing mortality for both targeted and bycatch stocks. To better understand and promote informed management decisions, I developed a bio-economic simulation model of marine groundfish and salmon recreational fisheries off Washington and Oregon while working as a contractor with the NOAA Fisheries Northwest Fisheries Science Center, using the R programming language. I collaborated with stakeholders from the fishing industry, state agencies, and NOAA Fisheries to ensure the model would be relevant to management decisions. I compiled data from 36 different sources and summarized and analyzed the data for inclusion in the simulation model, including zero-inflated negative binomial modeling of catch-per-trip and probability distribution analysis of catch-by-length. I shared this work through a presentation.
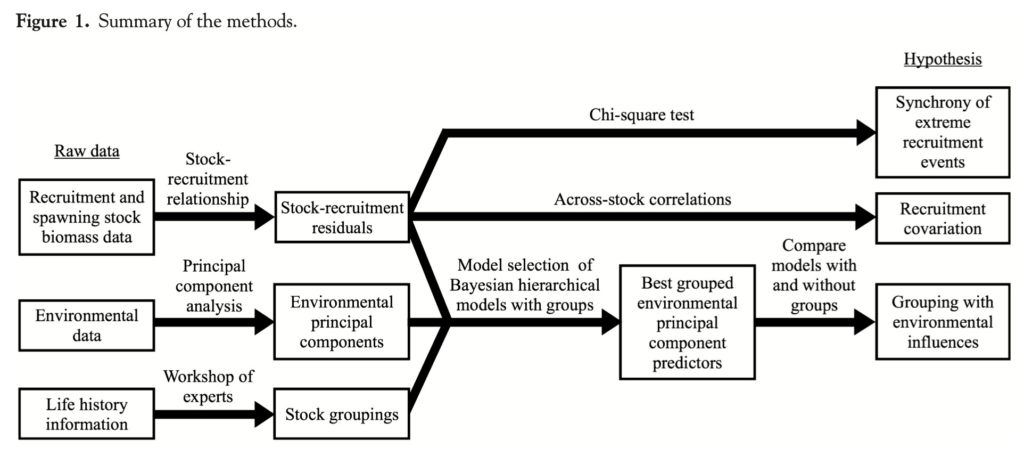
Understanding environmental influences on marine fish productivity is important for sustainable, ecosystem-based management of marine resources. This knowledge is particularly important for early life stages when fish are most sensitive to changes in the environment. As part of my master’s thesis at the University of Washington School of Aquatic and Fishery Sciences, I investigated the hypothesis that groups of Northeast Pacific marine fish stocks exhibit synchronous recruitment (the number of fish spawned in a certain year as they reach an age that they are susceptible to fishing) due to a shared susceptibility to environmental influences. I investigated the effects of regional environmental variables such as water temperature, freshwater runoff, and upwelling. I used Bayesian hierarchical models to model recruitment for groups of stocks with similar early life histories as a function of these environmental covariates. I shared the results of this work through a paper, which has been cited by over 50 subsequent publications, and presentations at scientific and fishery management meetings.
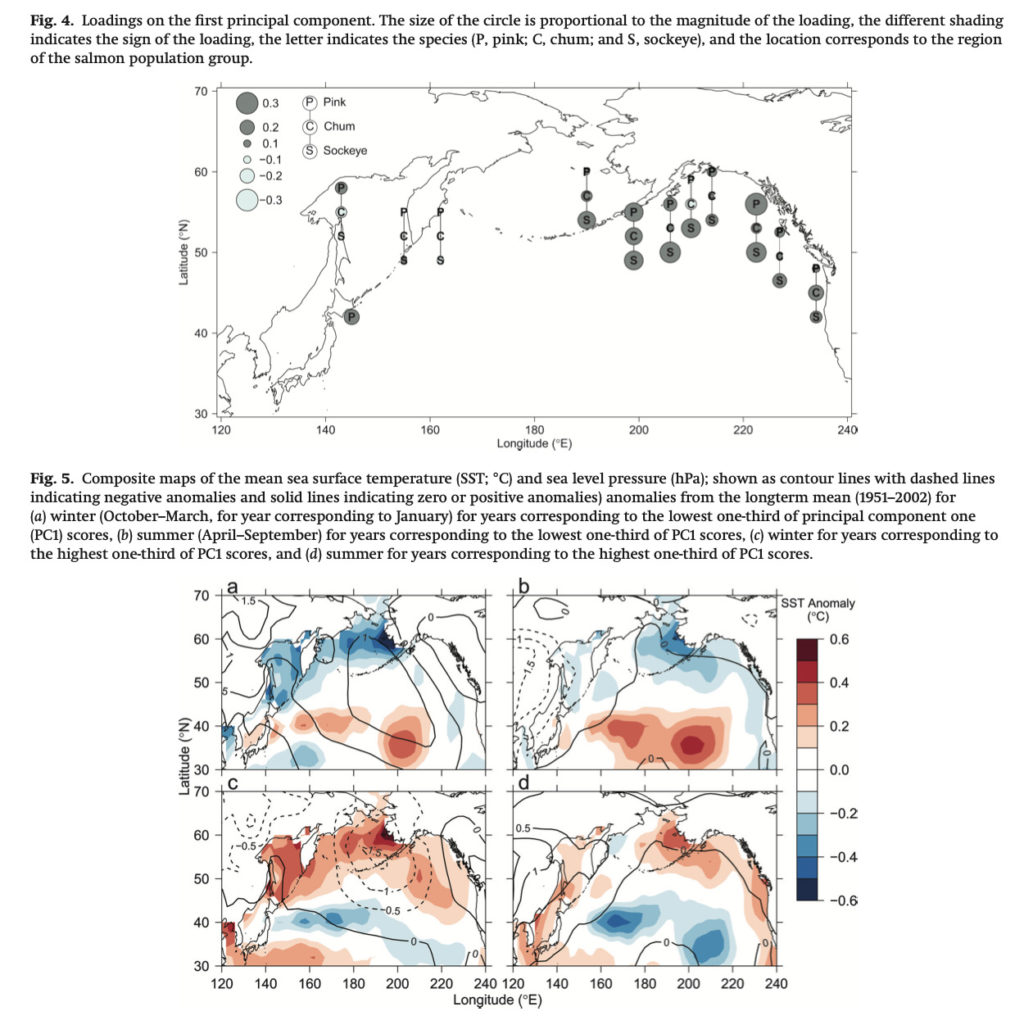
Understanding regional and large-scale patterns of salmon abundance within the North Pacific can aid in identifying related environmental patterns and better managing salmon fisheries. As part of my master’s thesis at the University of Washington School of Aquatic and Fishery Sciences, I utilized several multivariate statistics techniques, including principal component analysis, dynamic factor analysis, and nonmetric multidimensional scaling, to identify common patterns of variation in the abundance of wild pink, chum, and sockeye salmon from 34 population groups from Asia and western North America. I also identified oceanographic and atmospheric variables that covary with the major patterns of salmon abundance variations. I shared the results of this work through a paper, which has been cited by over 50 subsequent publications, and presentations.